Authors
Summary
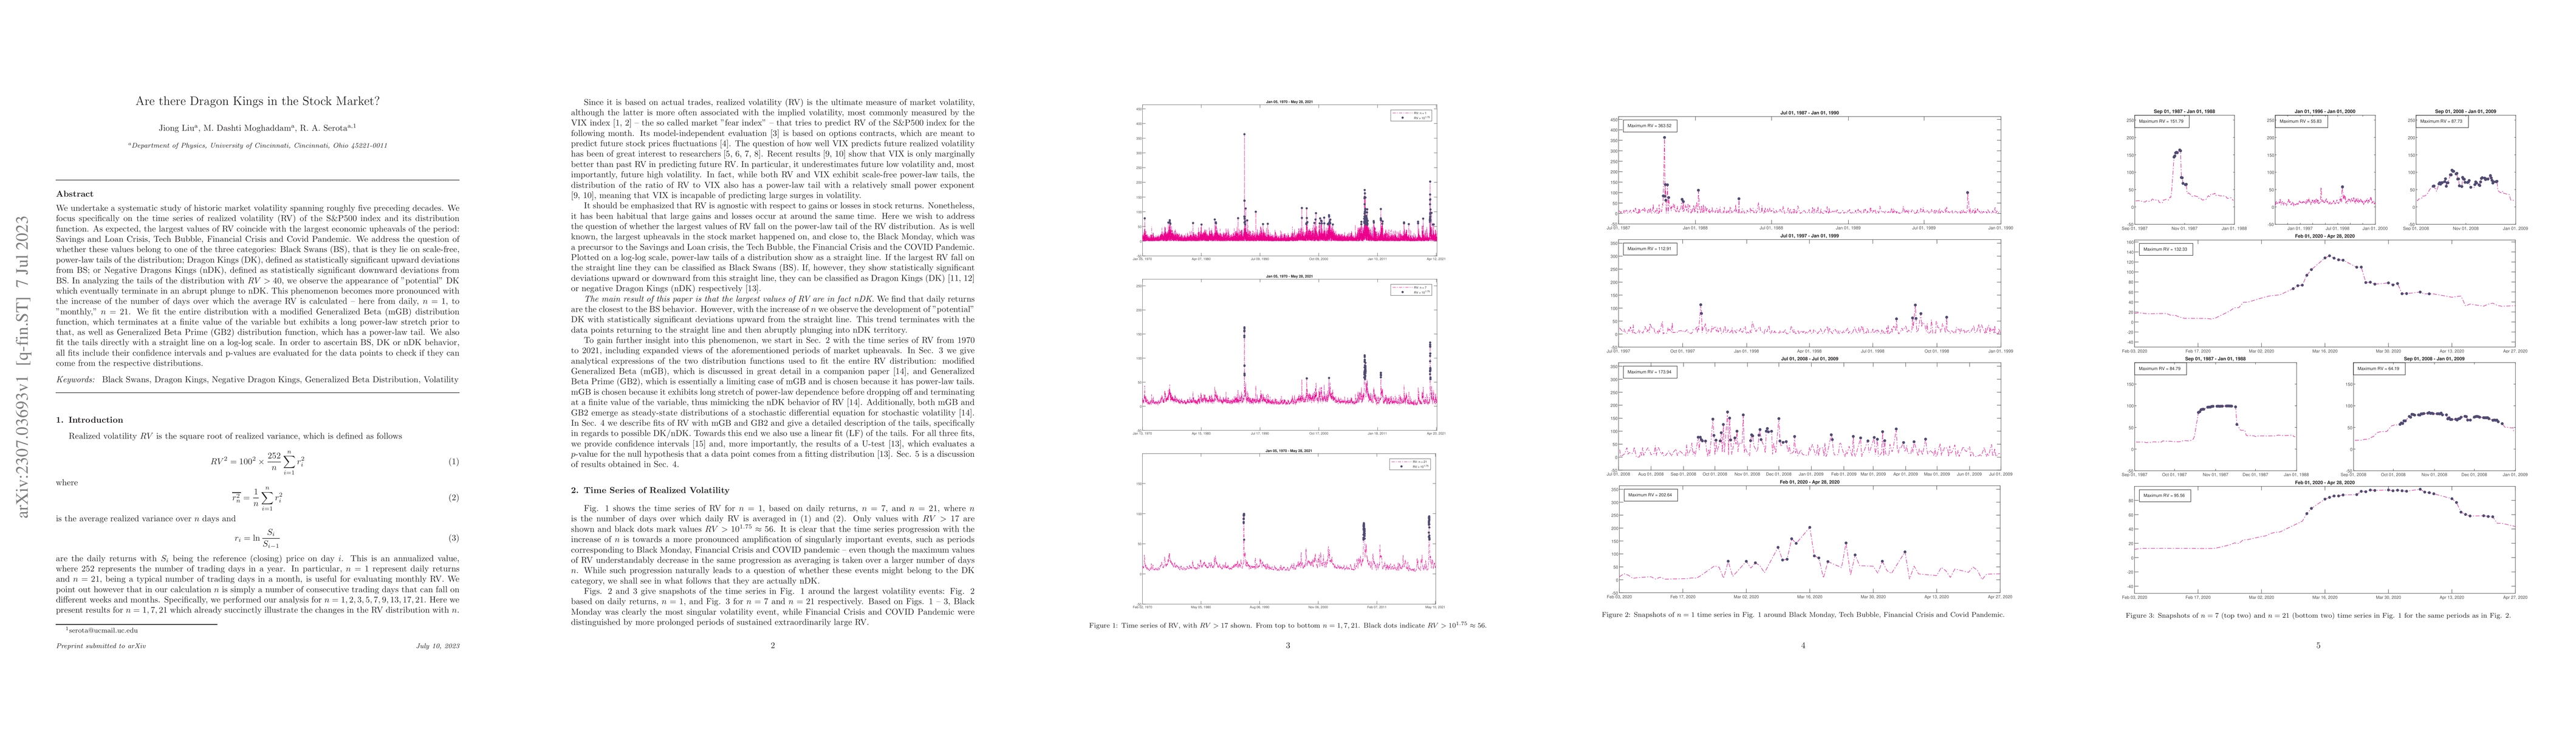
We undertake a systematic study of historic market volatility spanning roughly five preceding decades. We focus specifically on the time series of realized volatility (RV) of the S&P500 index and its distribution function. As expected, the largest values of RV coincide with the largest economic upheavals of the period: Savings and Loan Crisis, Tech Bubble, Financial Crisis and Covid Pandemic. We address the question of whether these values belong to one of the three categories: Black Swans (BS), that is they lie on scale-free, power-law tails of the distribution; Dragon Kings (DK), defined as statistically significant upward deviations from BS; or Negative Dragons Kings (nDK), defined as statistically significant downward deviations from BS. In analyzing the tails of the distribution with RV > 40, we observe the appearance of "potential" DK which eventually terminate in an abrupt plunge to nDK. This phenomenon becomes more pronounced with the increase of the number of days over which the average RV is calculated -- here from daily, n=1, to "monthly," n=21. We fit the entire distribution with a modified Generalized Beta (mGB) distribution function, which terminates at a finite value of the variable but exhibits a long power-law stretch prior to that, as well as Generalized Beta Prime (GB2) distribution function, which has a power-law tail. We also fit the tails directly with a straight line on a log-log scale. In order to ascertain BS, DK or nDK behavior, all fits include their confidence intervals and p-values are evaluated for the data points to check if they can come from the respective distributions.
AI Key Findings
Get AI-generated insights about this paper's methodology, results, and significance.
Paper Details
PDF Preview
Key Terms
Citation Network
Current paper (gray), citations (green), references (blue)
Display is limited for performance on very large graphs.
Similar Papers
Found 4 papers| Title | Authors | Year | Actions |
|---|
Comments (0)