Bayesian Mixed-Frequency Quantile Vector Autoregression: Eliciting tail risks of Monthly US GDP
Publication
Metrics
AI Quick Summary
This paper introduces a mixed-frequency quantile vector autoregression (MF-QVAR) model to better characterize economic risks, particularly tail risks, in monthly US GDP. The model leverages a Bayesian framework and multivariate asymmetric Laplace distribution to estimate conditional quantiles, facilitating timely risk assessments and policy interventions.
Paper Preview
Abstract
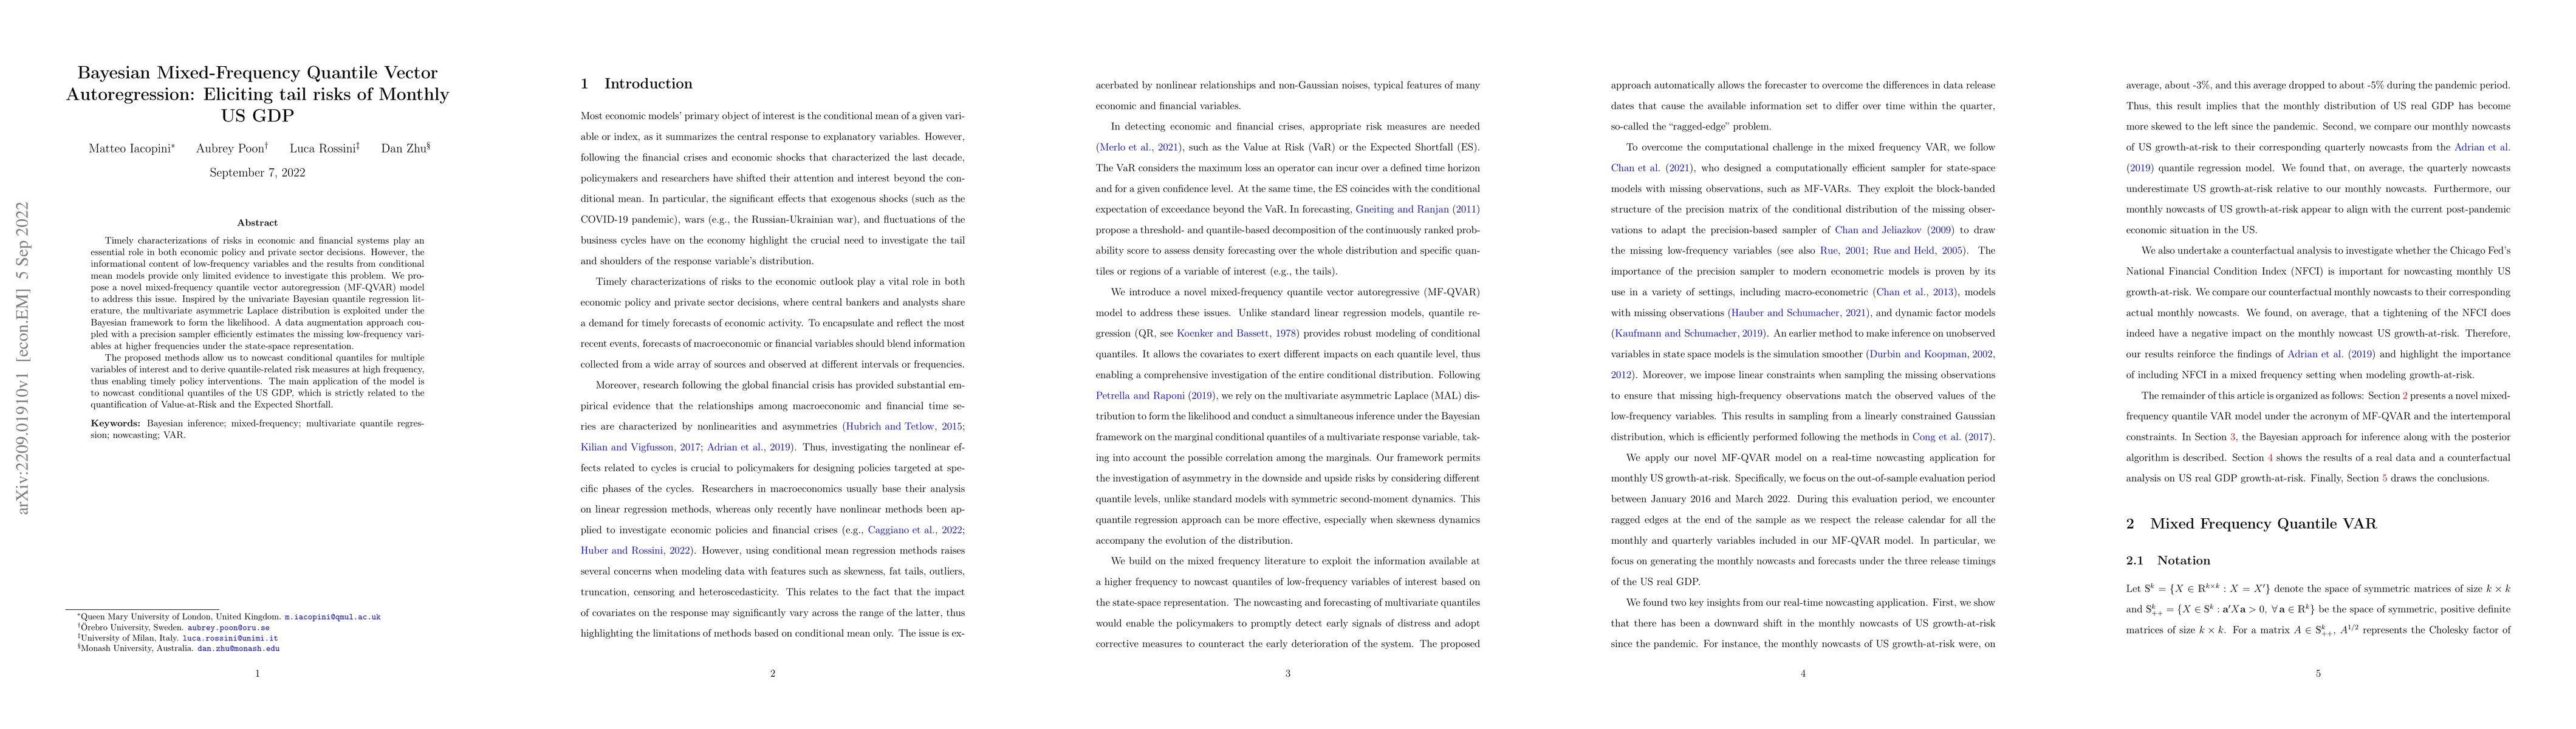
Timely characterizations of risks in economic and financial systems play an essential role in both economic policy and private sector decisions. However, the informational content of low-frequency variables and the results from conditional mean models provide only limited evidence to investigate this problem. We propose a novel mixed-frequency quantile vector autoregression (MF-QVAR) model to address this issue. Inspired by the univariate Bayesian quantile regression literature, the multivariate asymmetric Laplace distribution is exploited under the Bayesian framework to form the likelihood. A data augmentation approach coupled with a precision sampler efficiently estimates the missing low-frequency variables at higher frequencies under the state-space representation. The proposed methods allow us to nowcast conditional quantiles for multiple variables of interest and to derive quantile-related risk measures at high frequency, thus enabling timely policy interventions. The main application of the model is to nowcast conditional quantiles of the US GDP, which is strictly related to the quantification of Value-at-Risk and the Expected Shortfall.
AI Key Findings
Get AI-generated insights about this paper's methodology, results, significance, and more — seven facets brought into focus.
Impact
Paper Details
Authors
PDF Preview
Key Terms
Citation Network
Current paper (gray), citations (green), references (blue)
Display is limited for performance on very large graphs.
Discussion 0