Summary
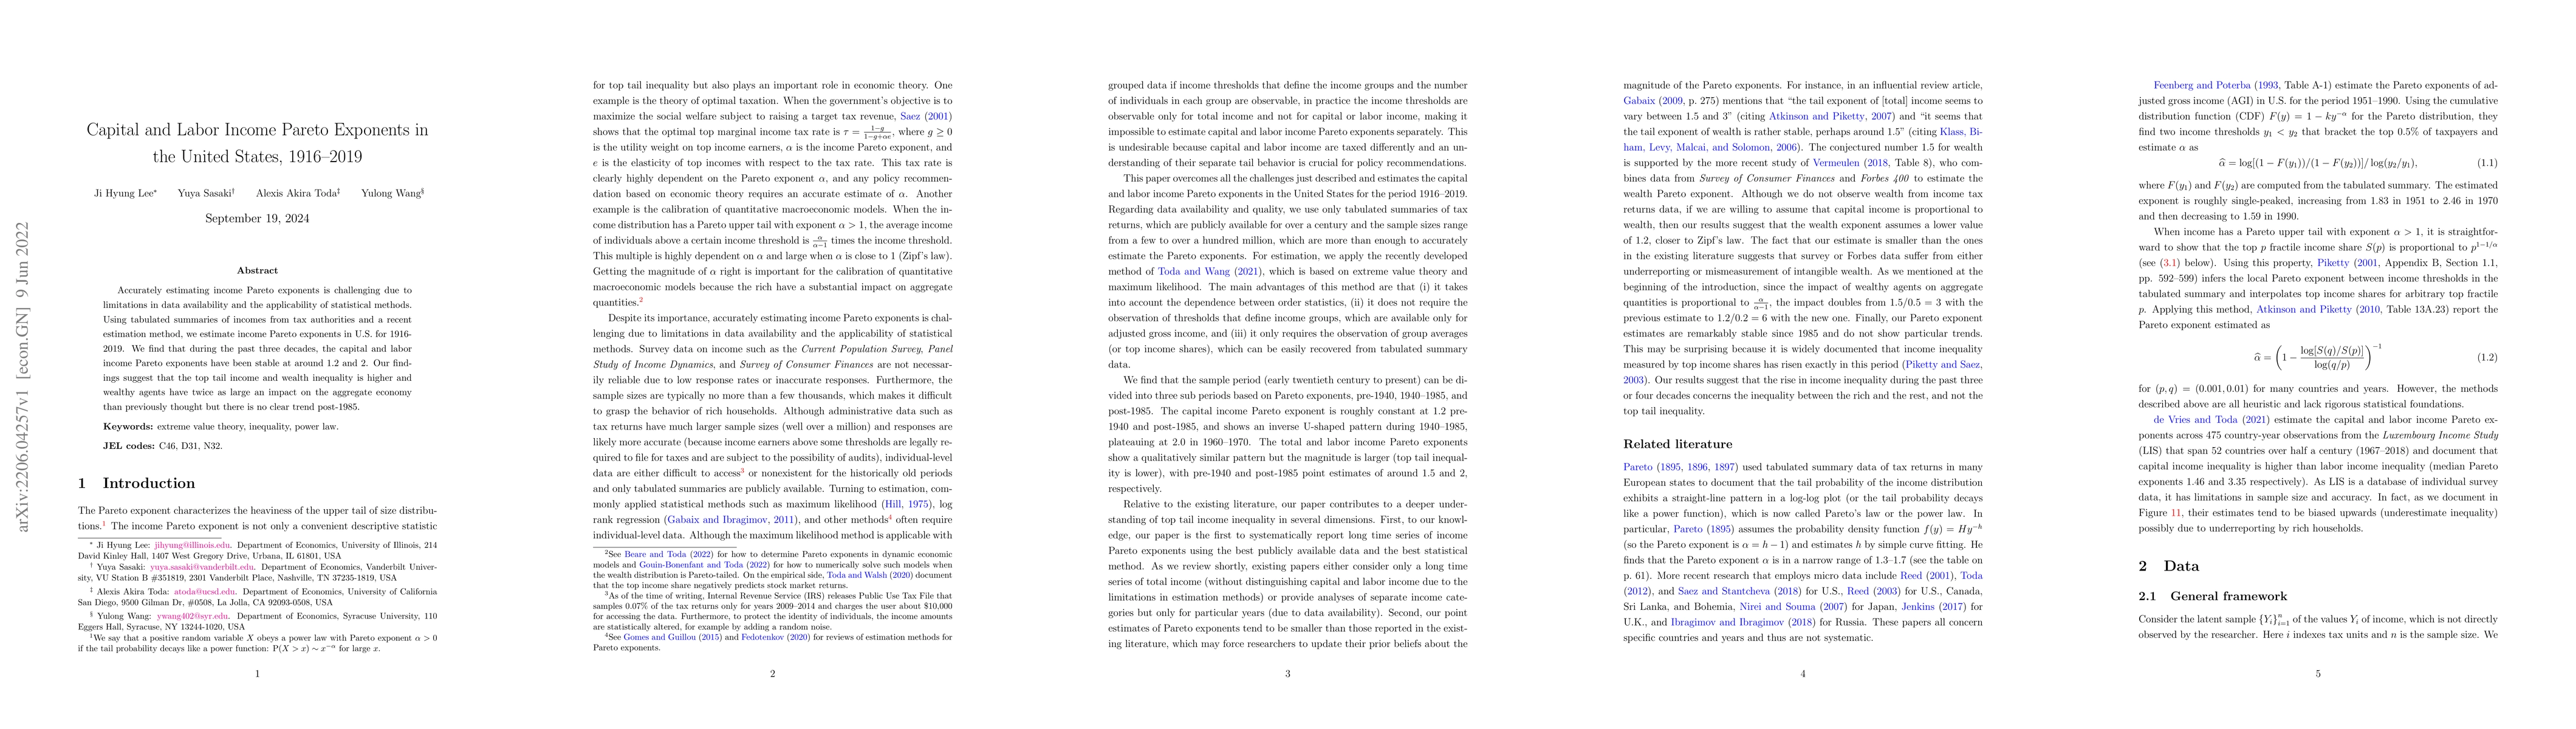
Accurately estimating income Pareto exponents is challenging due to limitations in data availability and the applicability of statistical methods. Using tabulated summaries of incomes from tax authorities and a recent estimation method, we estimate income Pareto exponents in U.S. for 1916-2019. We find that during the past three decades, the capital and labor income Pareto exponents have been stable at around 1.2 and 2. Our findings suggest that the top tail income and wealth inequality is higher and wealthy agents have twice as large an impact on the aggregate economy than previously thought but there is no clear trend post-1985.
AI Key Findings
Get AI-generated insights about this paper's methodology, results, and significance.
Paper Details
PDF Preview
Key Terms
Citation Network
Current paper (gray), citations (green), references (blue)
Display is limited for performance on very large graphs.
Similar Papers
Found 4 papers| Title | Authors | Year | Actions |
|---|
Comments (0)