Enhancing Dimension-Reduced Scatter Plots with Class and Feature Centroids
Publication
Metrics
AI Quick Summary
This paper proposes a method to enhance two-dimensional scatter plots created from high-dimensional biomedical data by overlaying class and feature centroids, thereby improving interpretability by linking low-dimensional coordinates back to the original high-dimensional space. The approach is demonstrated with neurogenetic disease phenotype data.
Paper Preview
Abstract
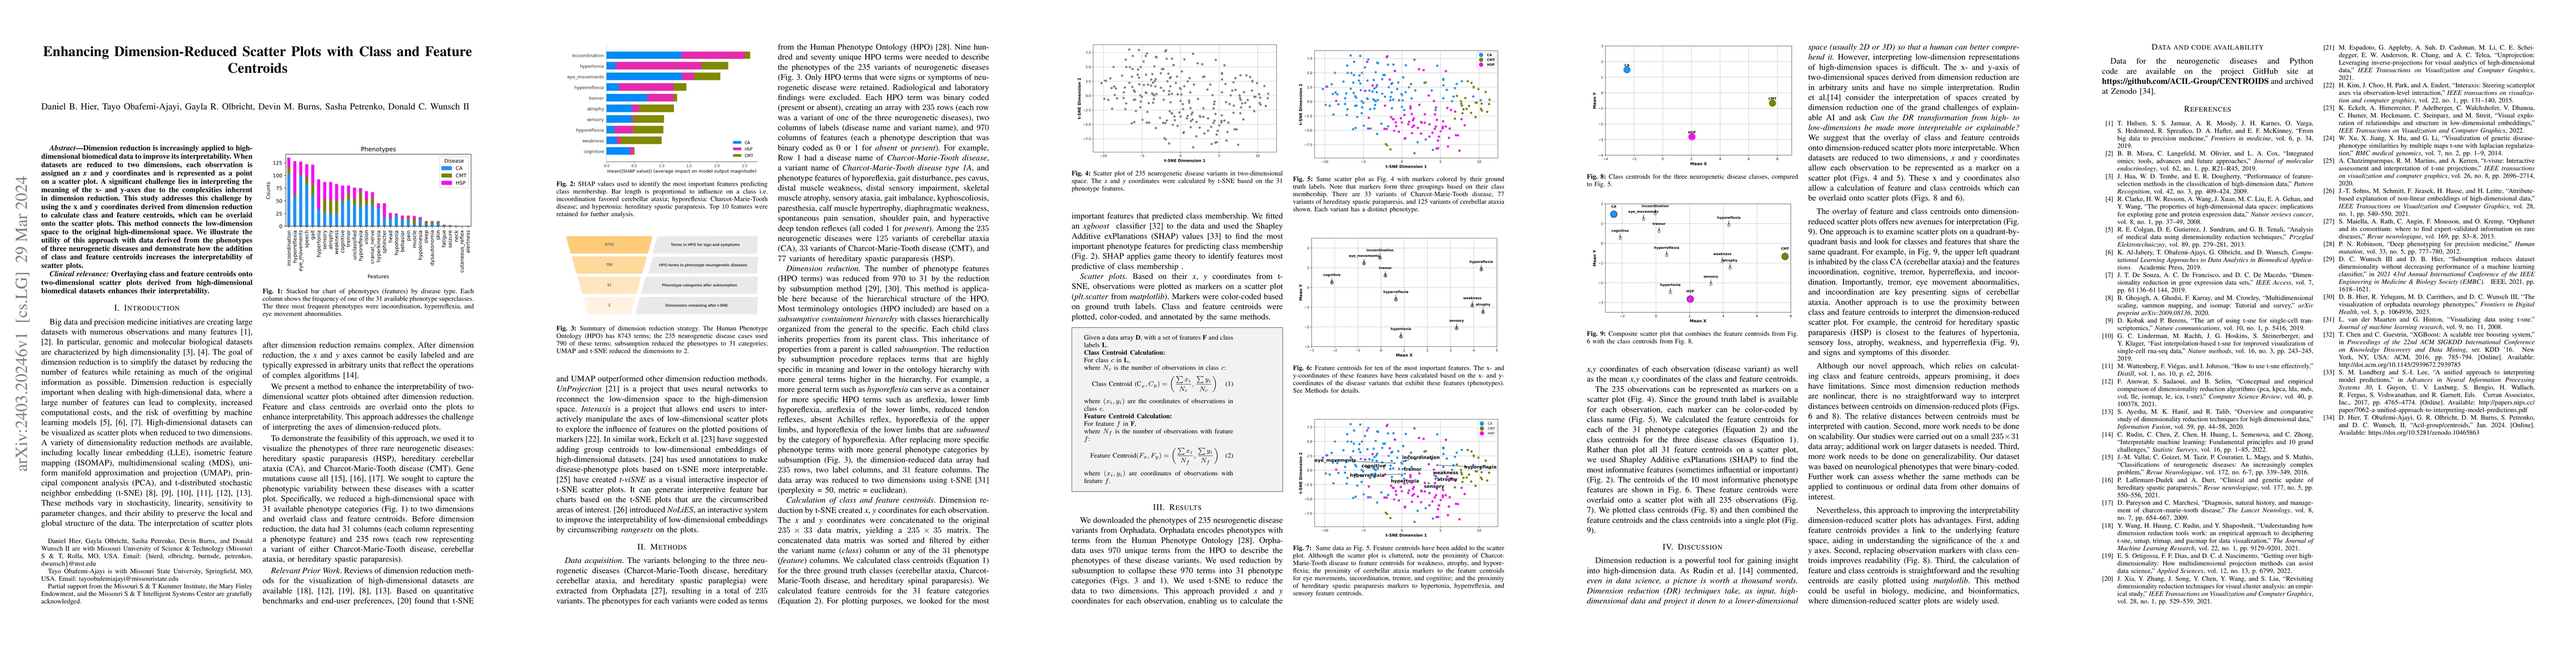
Dimension reduction is increasingly applied to high-dimensional biomedical data to improve its interpretability. When datasets are reduced to two dimensions, each observation is assigned an x and y coordinates and is represented as a point on a scatter plot. A significant challenge lies in interpreting the meaning of the x and y axes due to the complexities inherent in dimension reduction. This study addresses this challenge by using the x and y coordinates derived from dimension reduction to calculate class and feature centroids, which can be overlaid onto the scatter plots. This method connects the low-dimension space to the original high-dimensional space. We illustrate the utility of this approach with data derived from the phenotypes of three neurogenetic diseases and demonstrate how the addition of class and feature centroids increases the interpretability of scatter plots.
AI Key Findings
Get AI-generated insights about this paper's methodology, results, significance, and more — seven facets brought into focus.
Impact
Paper Details
Authors
PDF Preview
Key Terms
Citation Network
Current paper (gray), citations (green), references (blue)
Display is limited for performance on very large graphs.
Discussion 0