Publication
Metrics
AI Quick Summary
This paper evaluates three methods for measuring causality in financial time series, focusing on linear Granger causality, kernel Granger causality, and transfer entropy, with a special emphasis on capturing nonlinear causality. The study concludes that no single method is universally superior, and each method has its optimal application domain.
Paper Preview
Abstract
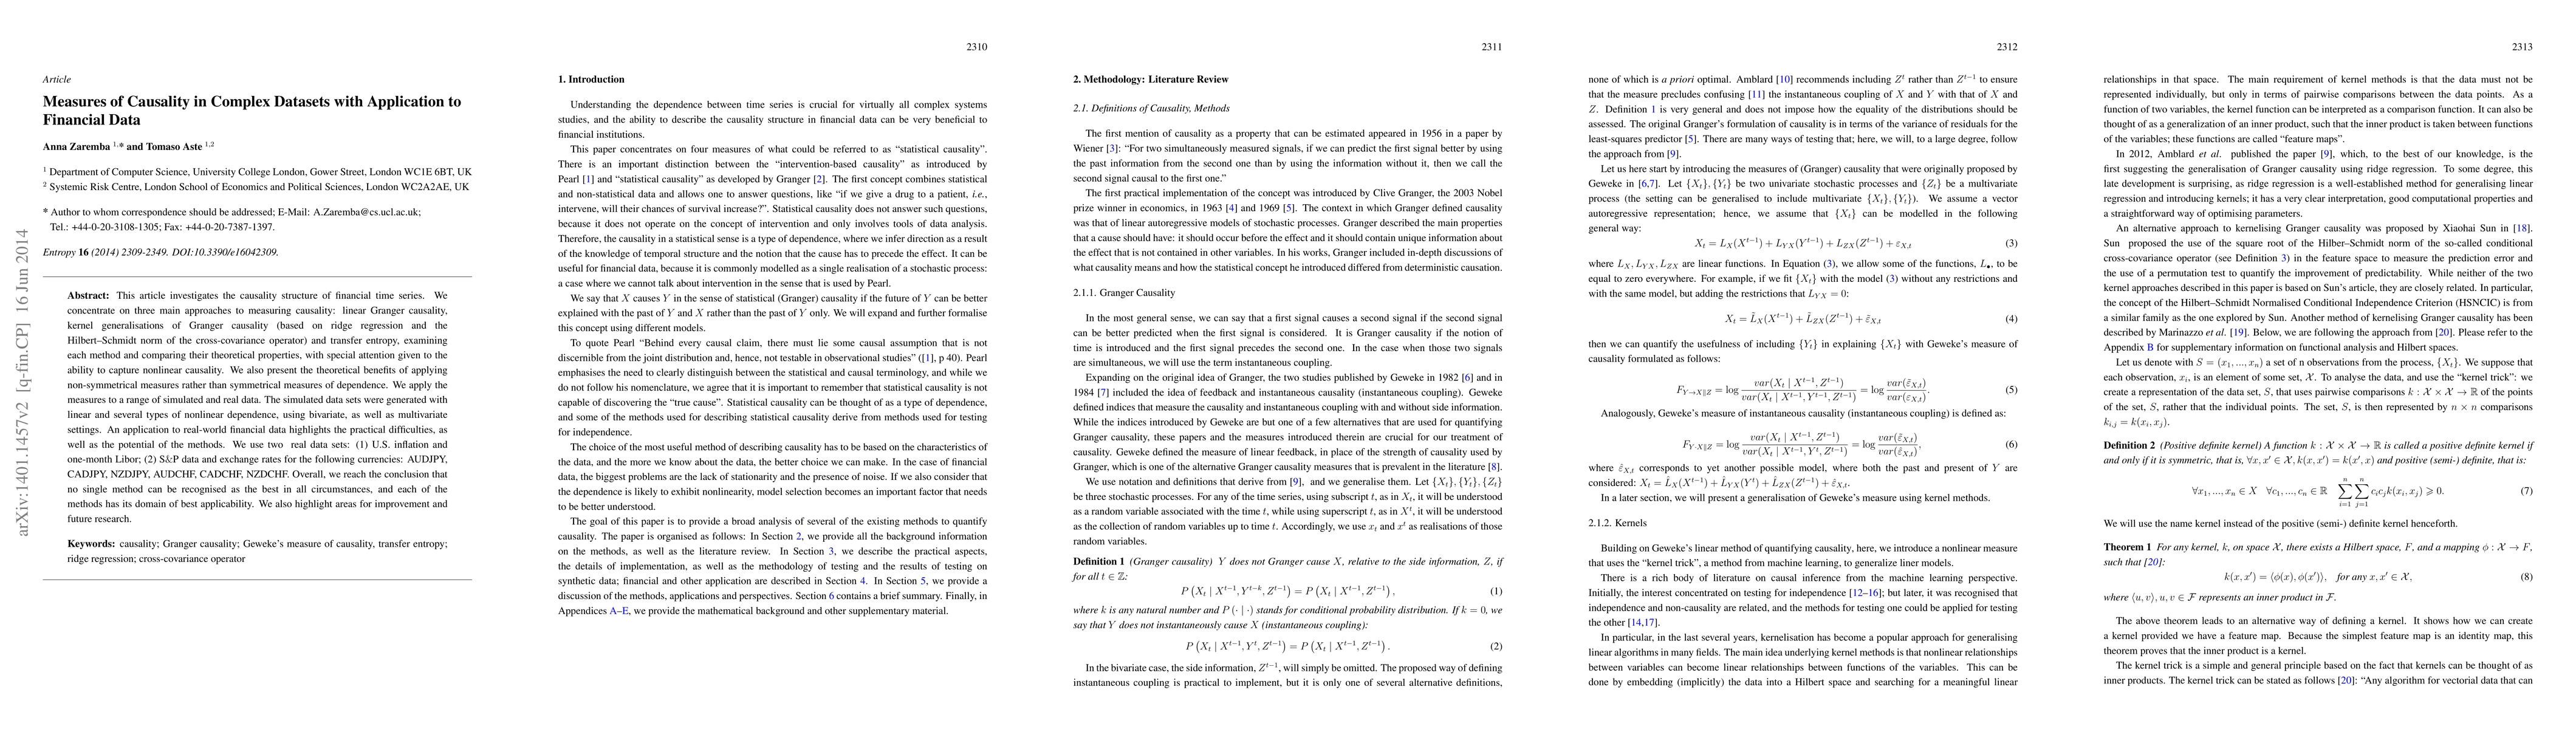
This article investigates the causality structure of financial time series. We concentrate on three main approaches to measuring causality: linear Granger causality, kernel generalisations of Granger causality (based on ridge regression and the Hilbert--Schmidt norm of the cross-covariance operator) and transfer entropy, examining each method and comparing their theoretical properties, with special attention given to the ability to capture nonlinear causality. We also present the theoretical benefits of applying non-symmetrical measures rather than symmetrical measures of dependence. We apply the measures to a range of simulated and real data. The simulated data sets were generated with linear and several types of nonlinear dependence, using bivariate, as well as multivariate settings. An application to real-world financial data highlights the practical difficulties, as well as the potential of the methods. We use two real data sets: (1) U.S. inflation and one-month Libor; (2) S$\&$P data and exchange rates for the following currencies: AUDJPY, CADJPY, NZDJPY, AUDCHF, CADCHF, NZDCHF. Overall, we reach the conclusion that no single method can be recognised as the best in all circumstances, and each of the methods has its domain of best applicability. We also highlight areas for improvement and future research.
AI Key Findings
Get AI-generated insights about this paper's methodology, results, significance, and more — seven facets brought into focus.
Impact
Paper Details
PDF Preview
Key Terms
Citation Network
Current paper (gray), citations (green), references (blue)
Display is limited for performance on very large graphs.
Discussion 0