The Yield Curve as a Recession Leading Indicator. An Application for Gradient Boosting and Random Forest
Publication
Metrics
AI Quick Summary
This paper explores the use of gradient boosting and random forest methods to predict US economic recessions based on Treasury term spreads, with a focus on the 3-6 month spread. The study compares these models to identify the most interpretable and effective approach, utilizing SHAP for feature importance analysis.
Paper Preview
Abstract
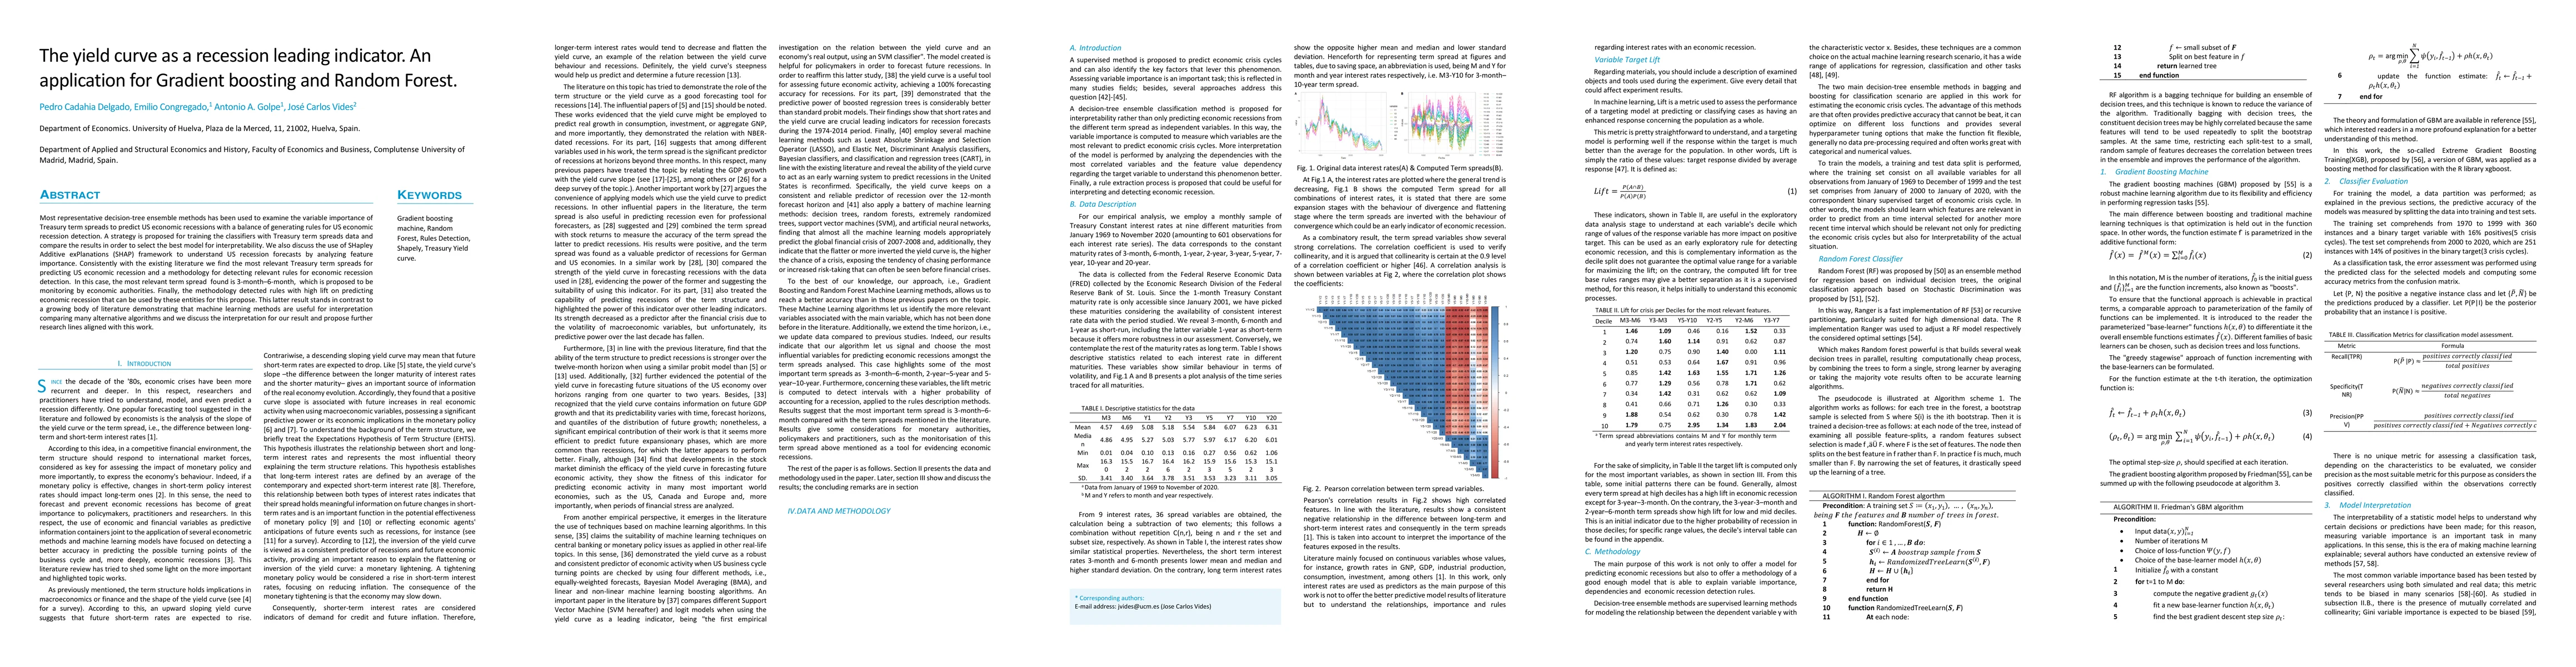
Most representative decision tree ensemble methods have been used to examine the variable importance of Treasury term spreads to predict US economic recessions with a balance of generating rules for US economic recession detection. A strategy is proposed for training the classifiers with Treasury term spreads data and the results are compared in order to select the best model for interpretability. We also discuss the use of SHapley Additive exPlanations (SHAP) framework to understand US recession forecasts by analyzing feature importance. Consistently with the existing literature we find the most relevant Treasury term spreads for predicting US economic recession and a methodology for detecting relevant rules for economic recession detection. In this case, the most relevant term spread found is 3 month to 6 month, which is proposed to be monitored by economic authorities. Finally, the methodology detected rules with high lift on predicting economic recession that can be used by these entities for this propose. This latter result stands in contrast to a growing body of literature demonstrating that machine learning methods are useful for interpretation comparing many alternative algorithms and we discuss the interpretation for our result and propose further research lines aligned with this work.
AI Key Findings
Get AI-generated insights about this paper's methodology, results, significance, and more — seven facets brought into focus.
Impact
Paper Details
Authors
PDF Preview
Key Terms
Citation Network
Current paper (gray), citations (green), references (blue)
Display is limited for performance on very large graphs.
Discussion 0