Chart-to-Text: A Large-Scale Benchmark for Chart Summarization
Publication
Metrics
AI Quick Summary
This paper introduces Chart-to-Text, a large-scale benchmark for summarizing charts into natural language, featuring 44,096 charts and two datasets. The study evaluates state-of-the-art neural models for chart summarization, highlighting challenges in generating accurate and insightful summaries despite achieving fluency and reasonable BLEU scores.
Paper Preview
Abstract
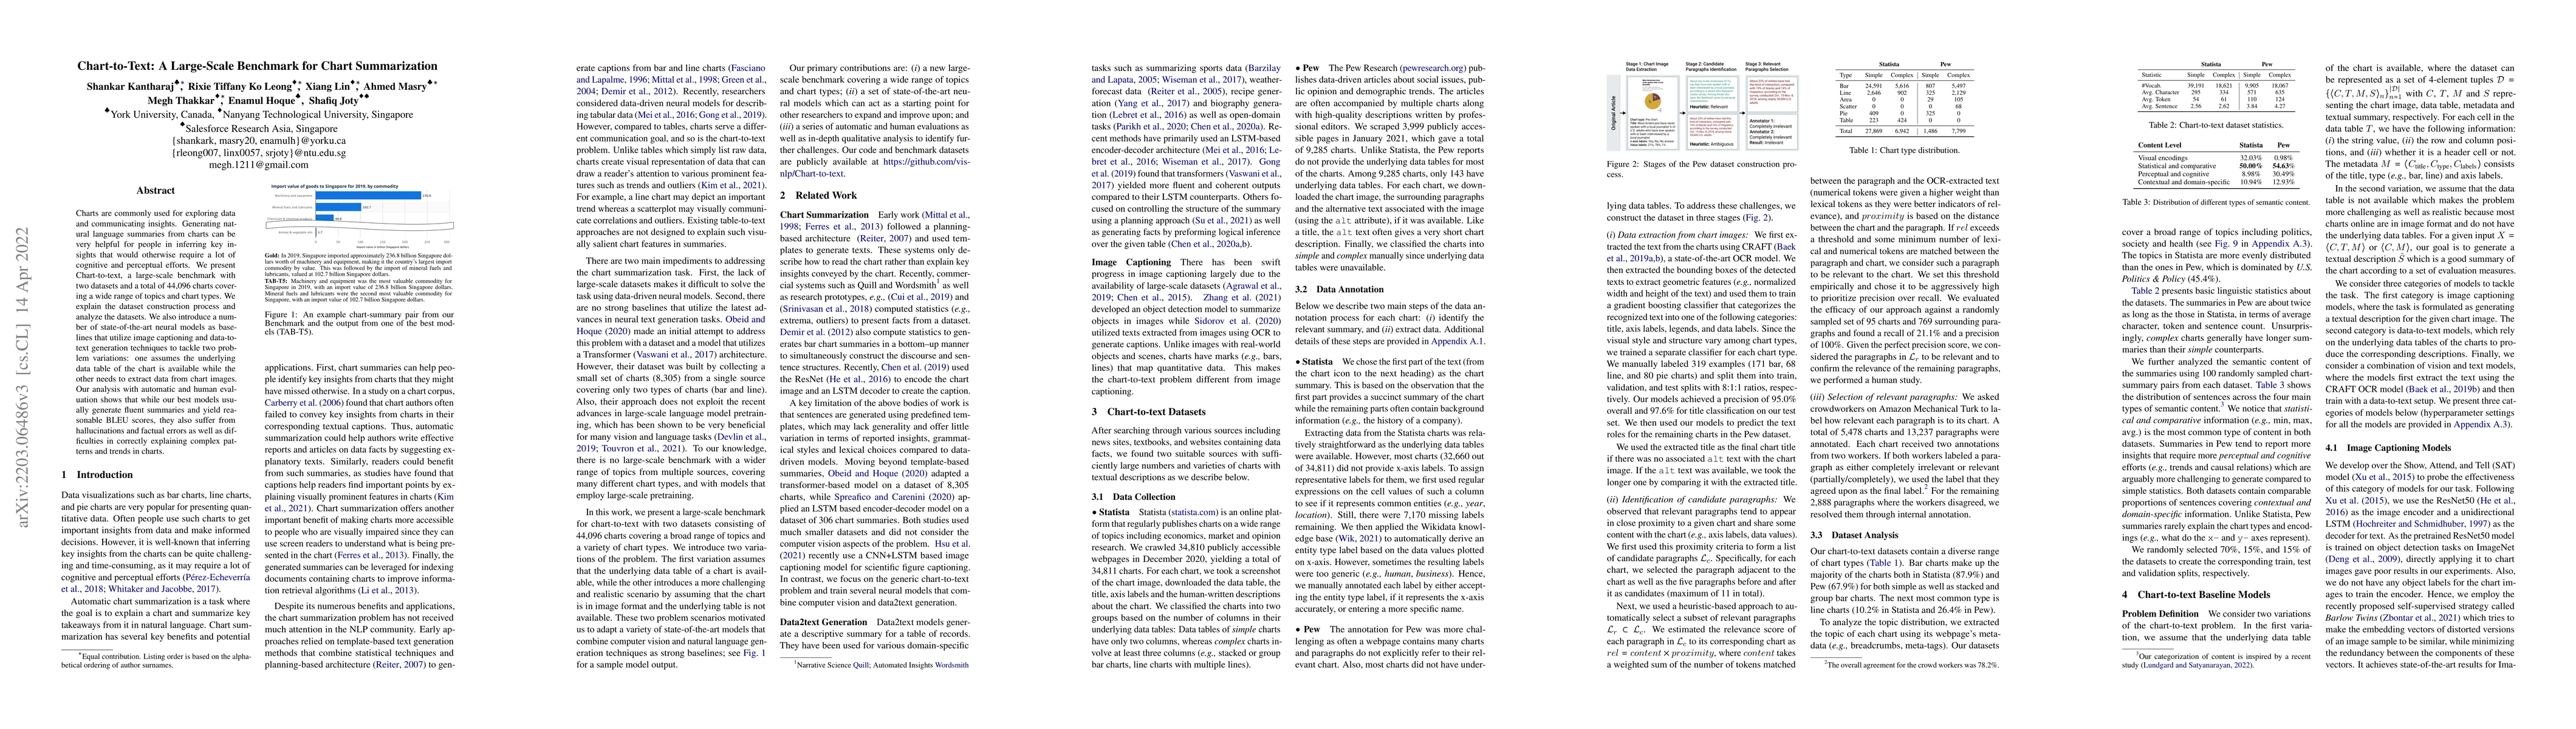
Charts are commonly used for exploring data and communicating insights. Generating natural language summaries from charts can be very helpful for people in inferring key insights that would otherwise require a lot of cognitive and perceptual efforts. We present Chart-to-text, a large-scale benchmark with two datasets and a total of 44,096 charts covering a wide range of topics and chart types. We explain the dataset construction process and analyze the datasets. We also introduce a number of state-of-the-art neural models as baselines that utilize image captioning and data-to-text generation techniques to tackle two problem variations: one assumes the underlying data table of the chart is available while the other needs to extract data from chart images. Our analysis with automatic and human evaluation shows that while our best models usually generate fluent summaries and yield reasonable BLEU scores, they also suffer from hallucinations and factual errors as well as difficulties in correctly explaining complex patterns and trends in charts.
AI Key Findings
Get AI-generated insights about this paper's methodology, results, significance, and more — seven facets brought into focus.
Impact
Paper Details
Authors
PDF Preview
Key Terms
Citation Network
Current paper (gray), citations (green), references (blue)
Display is limited for performance on very large graphs.
Discussion 0