Dynamic Portfolio Cuts: A Spectral Approach to Graph-Theoretic Diversification
Publication
Metrics
AI Quick Summary
This paper proposes graph spectral estimators for dynamic portfolio diversification, addressing the nonstationarity of asset price movements. It introduces dynamic spectral portfolio cuts to partition a time-evolving market graph, enabling robust and adaptive asset allocation, and demonstrates its benefits through real-world data analysis.
Paper Preview
Abstract
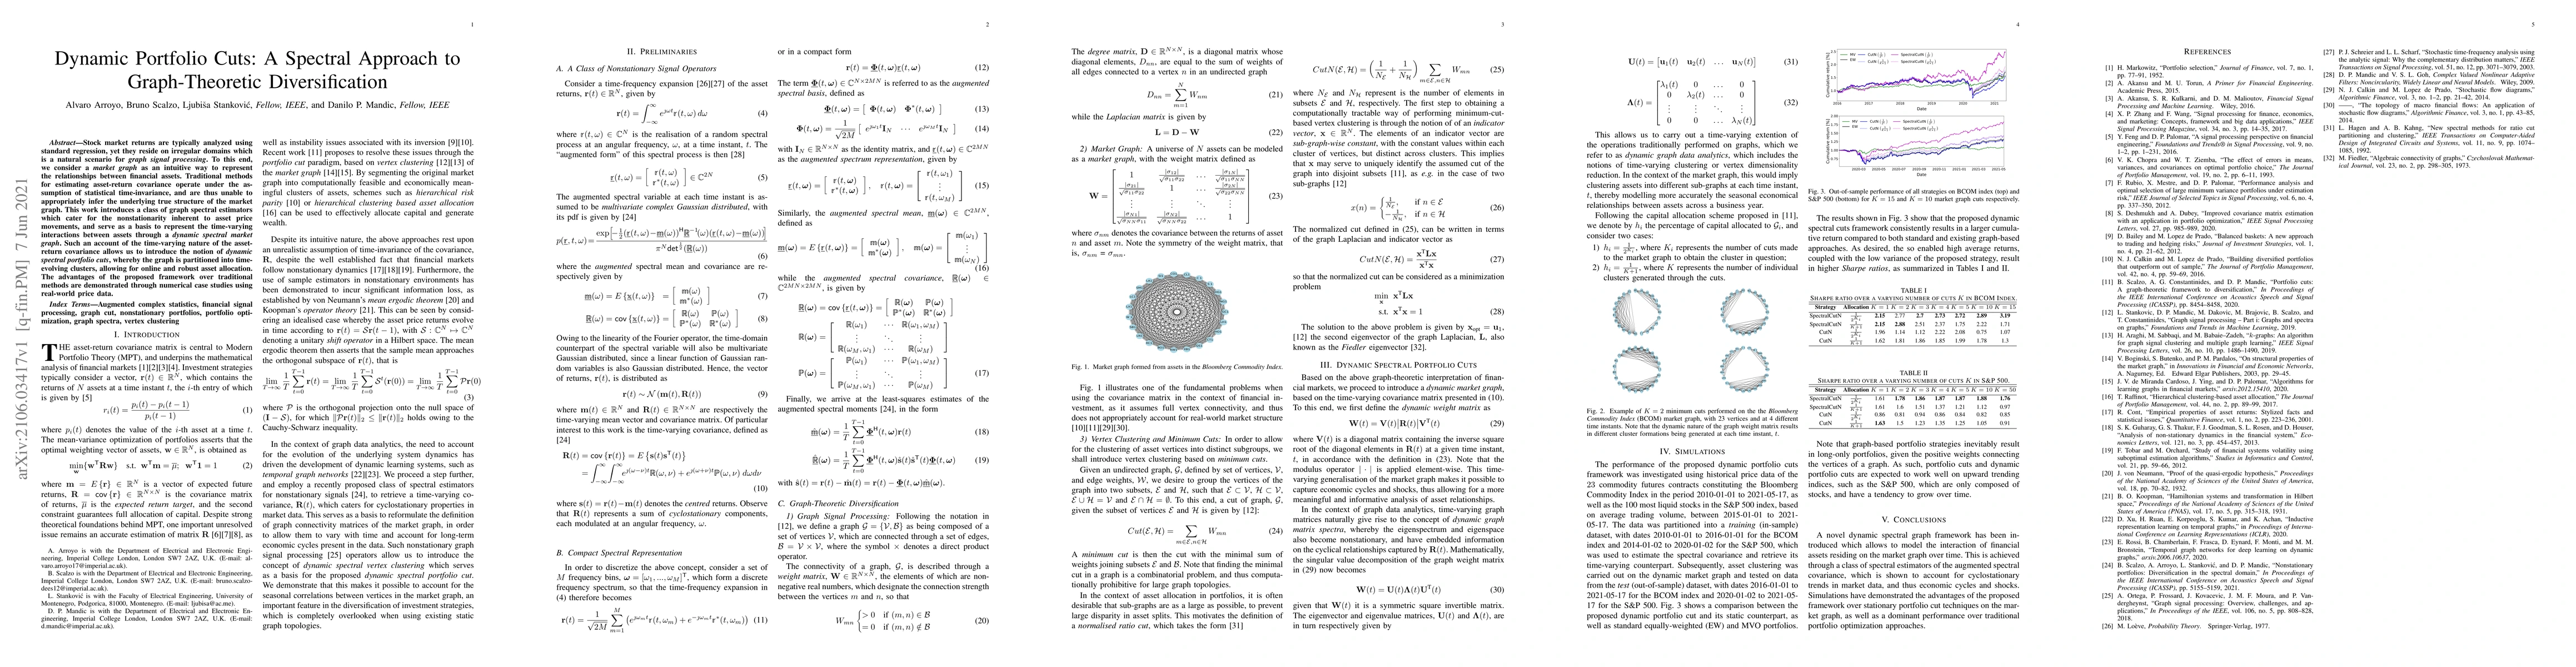
Stock market returns are typically analyzed using standard regression, yet they reside on irregular domains which is a natural scenario for graph signal processing. To this end, we consider a market graph as an intuitive way to represent the relationships between financial assets. Traditional methods for estimating asset-return covariance operate under the assumption of statistical time-invariance, and are thus unable to appropriately infer the underlying true structure of the market graph. This work introduces a class of graph spectral estimators which cater for the nonstationarity inherent to asset price movements, and serve as a basis to represent the time-varying interactions between assets through a dynamic spectral market graph. Such an account of the time-varying nature of the asset-return covariance allows us to introduce the notion of dynamic spectral portfolio cuts, whereby the graph is partitioned into time-evolving clusters, allowing for online and robust asset allocation. The advantages of the proposed framework over traditional methods are demonstrated through numerical case studies using real-world price data.
AI Key Findings
Get AI-generated insights about this paper's methodology, results, significance, and more — seven facets brought into focus.
Impact
Paper Details
Authors
PDF Preview
Key Terms
Citation Network
Current paper (gray), citations (green), references (blue)
Display is limited for performance on very large graphs.
Discussion 0