Authors
Summary
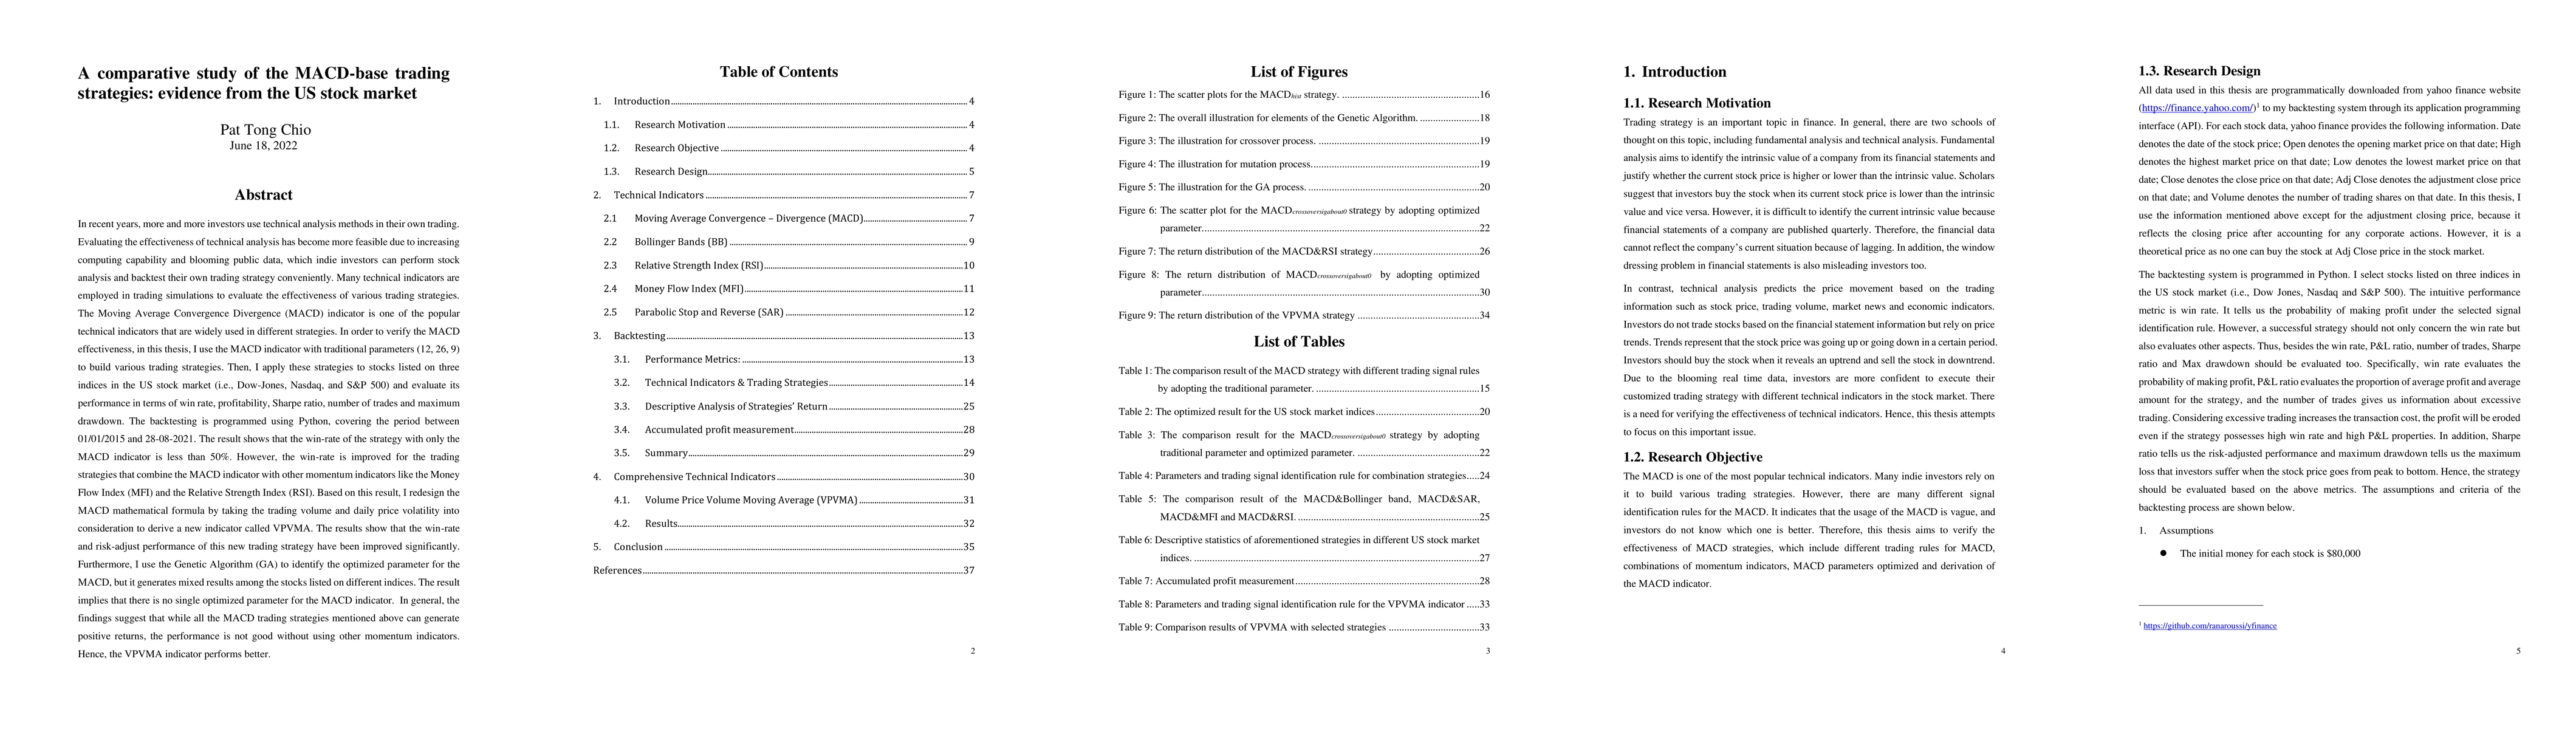
In recent years, more and more investors use technical analysis methods in their own trading. Evaluating the effectiveness of technical analysis has become more feasible due to increasing computing capability and blooming public data, which indie investors can perform stock analysis and backtest their own trading strategy conveniently. The Moving Average Convergence Divergence (MACD) indicator is one of the popular technical indicators that are widely used in different strategies. In order to verify the MACD effectiveness, in this thesis, I use the MACD indicator with traditional parameters (12, 26, 9) to build various trading strategies. Then, I apply these strategies to stocks listed on three indices in the US stock market (i.e., Dow-Jones, Nasdaq, and S&P 500) and evaluate its performance in terms of win rate, profitability, Sharpe ratio, number of trades and maximum drawdown. The backtesting is programmed using Python, covering the period between 01/01/2015 and 28-08-2021. The result shows that the win-rate of the strategy with only the MACD indicator is less than 50%. However, the win-rate is improved for the trading strategies that combine the MACD indicator with other momentum indicators like the Money Flow Index (MFI) and the Relative Strength Index (RSI). Based on this result, I redesign the MACD mathematical formula by taking the trading volume and daily price volatility into consideration to derive a new indicator called VPVMA. The results show that the win-rate and risk-adjust performance of this new trading strategy have been improved significantly. In general, the findings suggest that while all the MACD trading strategies mentioned above can generate positive returns, the performance is not good without using other momentum indicators. Hence, the VPVMA indicator performs better.
AI Key Findings
Get AI-generated insights about this paper's methodology, results, and significance.
Paper Details
PDF Preview
Key Terms
Citation Network
Current paper (gray), citations (green), references (blue)
Display is limited for performance on very large graphs.
Similar Papers
Found 4 papers| Title | Authors | Year | Actions |
|---|
Comments (0)