Publication
Metrics
Paper Preview
Abstract
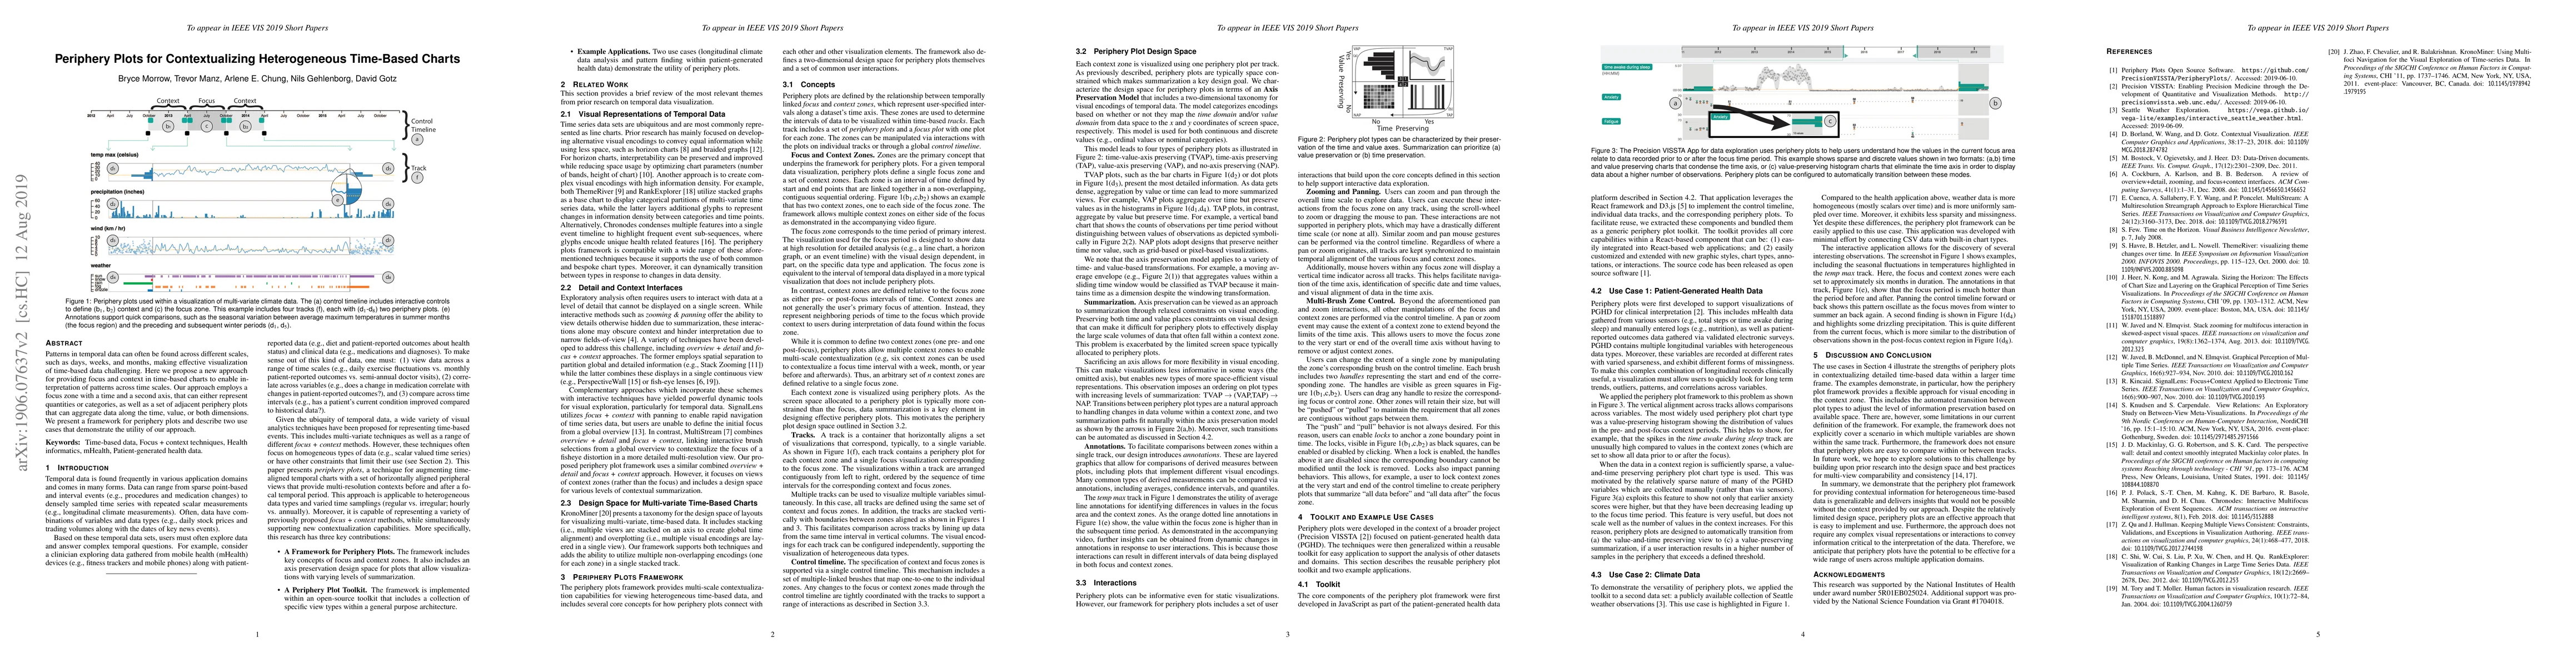
Patterns in temporal data can often be found across different scales, such as days, weeks, and months, making effective visualization of time-based data challenging. Here we propose a new approach for providing focus and context in time-based charts to enable interpretation of patterns across time scales. Our approach employs a focus zone with a time and a second axis, that can either represent quantities or categories, as well as a set of adjacent periphery plots that can aggregate data along the time, value, or both dimensions. We present a framework for periphery plots and describe two use cases that demonstrate the utility of our approach.
AI Key Findings
Get AI-generated insights about this paper's methodology, results, significance, and more — seven facets brought into focus.
Impact
Paper Details
Authors
PDF Preview
Key Terms
Citation Network
Current paper (gray), citations (green), references (blue)
Display is limited for performance on very large graphs.
Discussion 0