Publication
Metrics
AI Quick Summary
This paper surveys visual analytics techniques for 3D urban data, categorizing studies based on use cases, analysis tasks, data types, and visualization methods. It identifies gaps and future research directions to enhance urban planning, architecture, and engineering through better visual tools.
Paper Preview
Abstract
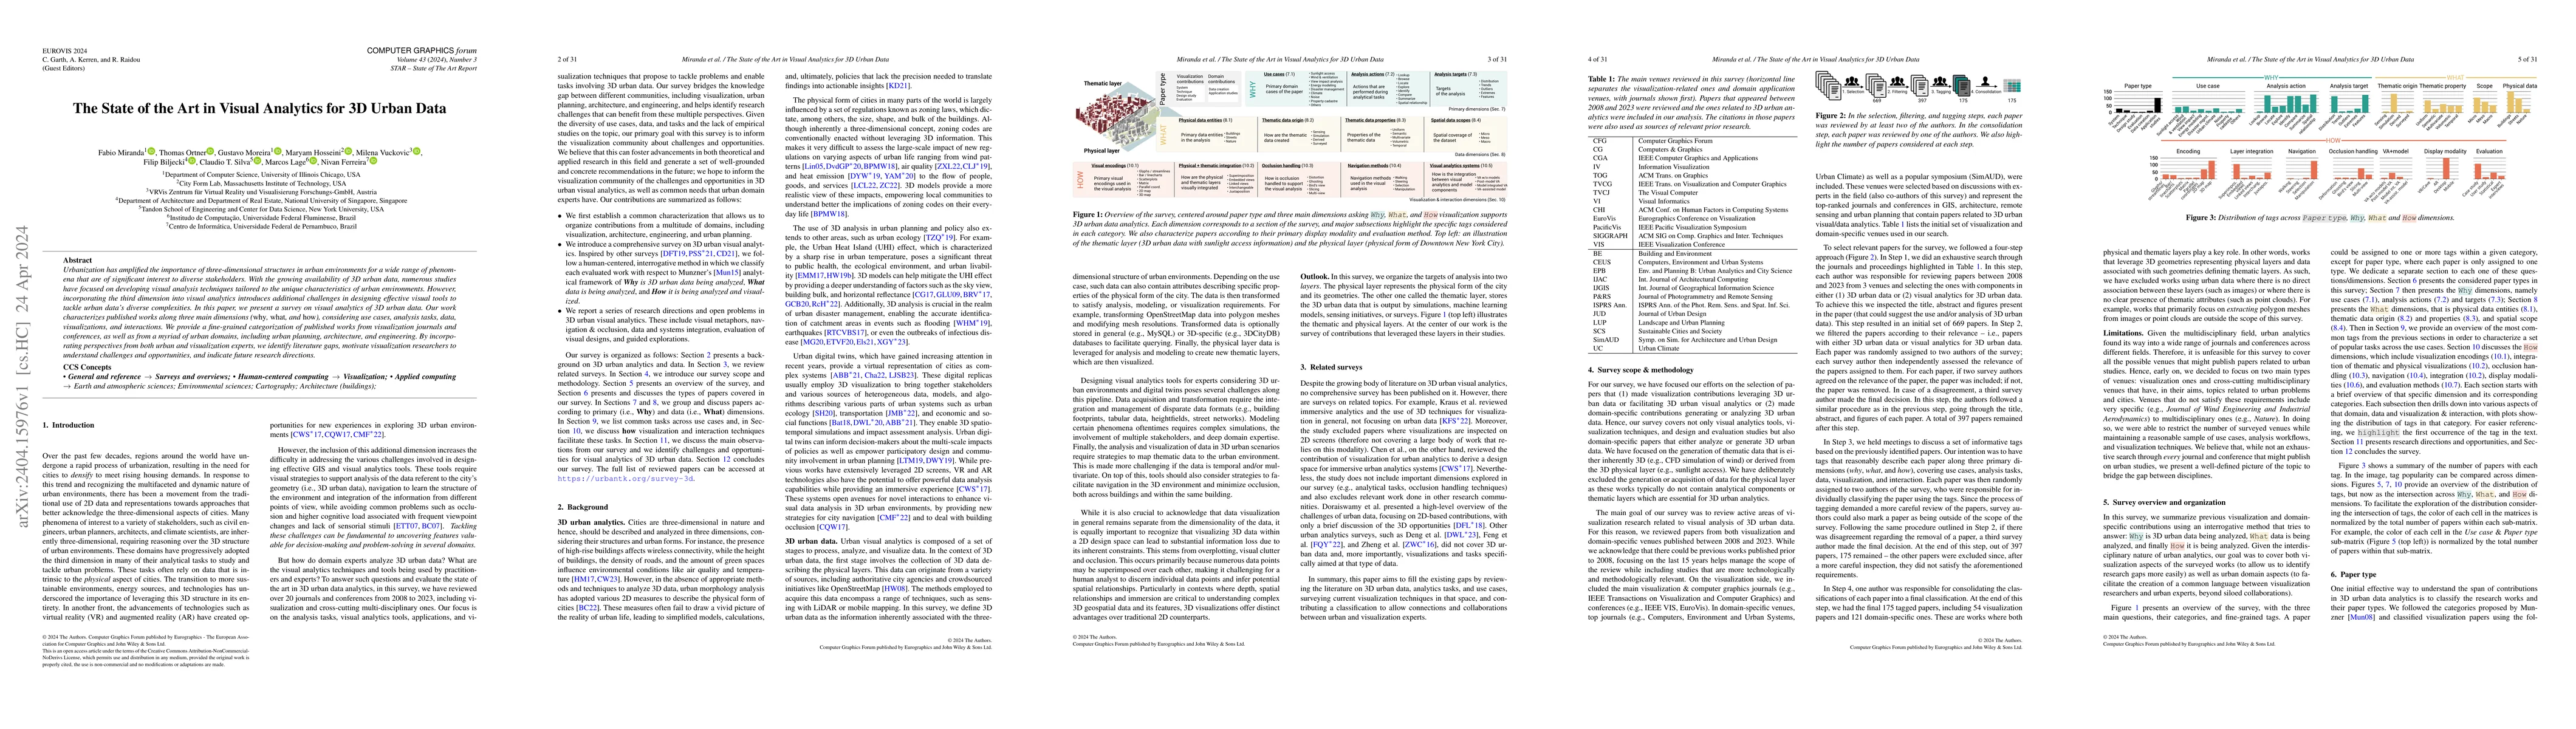
Urbanization has amplified the importance of three-dimensional structures in urban environments for a wide range of phenomena that are of significant interest to diverse stakeholders. With the growing availability of 3D urban data, numerous studies have focused on developing visual analysis techniques tailored to the unique characteristics of urban environments. However, incorporating the third dimension into visual analytics introduces additional challenges in designing effective visual tools to tackle urban data's diverse complexities. In this paper, we present a survey on visual analytics of 3D urban data. Our work characterizes published works along three main dimensions (why, what, and how), considering use cases, analysis tasks, data, visualizations, and interactions. We provide a fine-grained categorization of published works from visualization journals and conferences, as well as from a myriad of urban domains, including urban planning, architecture, and engineering. By incorporating perspectives from both urban and visualization experts, we identify literature gaps, motivate visualization researchers to understand challenges and opportunities, and indicate future research directions.
AI Key Findings
Get AI-generated insights about this paper's methodology, results, significance, and more — seven facets brought into focus.
Impact
Paper Details
Authors
PDF Preview
Key Terms
Citation Network
Current paper (gray), citations (green), references (blue)
Display is limited for performance on very large graphs.
Discussion 0